You can contact LEARNZ, part of CORE Education, at:
Postal Address:
PO Box 13 678,
Christchurch 8141,
New Zealand
Topographic maps are detailed, accurate graphic representations of the features that appear on the Earth’s surface.
Topographic Maps are helpful in the high country because they show land features and terrain.
A topographic map shows the following features;
Before the features from the Earth's curved surface can be shown on a flat map, the position of a constant point is needed. This fixed point is called a geodetic datum and for New Zealand is based on the Earth's centre of mass.
The level of detail shown on maps depends on the scale of the map. A small scale map shows less detail than a larger scale map.
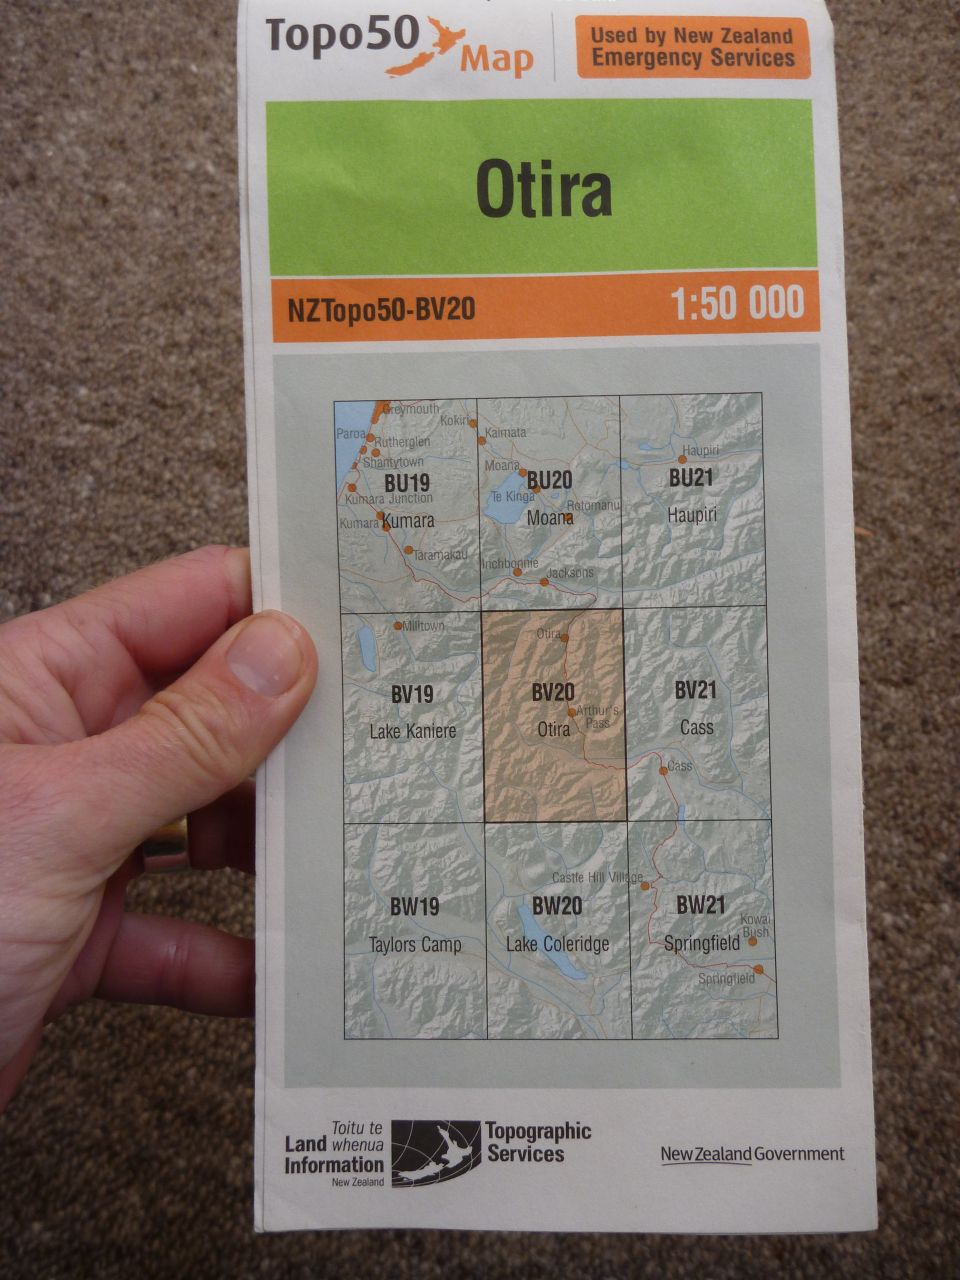
In New Zealand topographic maps are made by Land Information New Zealand (LINZ). These maps are at a scale of 1:50 000 which means one centimetre on the map represents 50 000 centimetres, or 500 metres on the ground. These maps are known as Topo50 maps.
LINZ also produces smaller scale maps at 1:250 000, 1:500 000, 1:1 million and 1:2 million scales. These maps are useful for planning travel over large distances, or for giving an overview of New Zealand.
Examples of map scales;
| Scale | Ground distance of 1cm on the map |
| 1:50 000 | 500 metres (NZ Topo50 maps) |
| 1:250 000 | 2.5 kilometres |
| 1:1 million | 10 kilometres |
| 1:2 million | 20 kilometres |
Topo50 maps show geographic features in detail. They are useful for a wide range of activities, such as;
Topographic maps include a north point in the map margin information. This shows the direction of Grid North and Magnetic North and is used to orient the map.
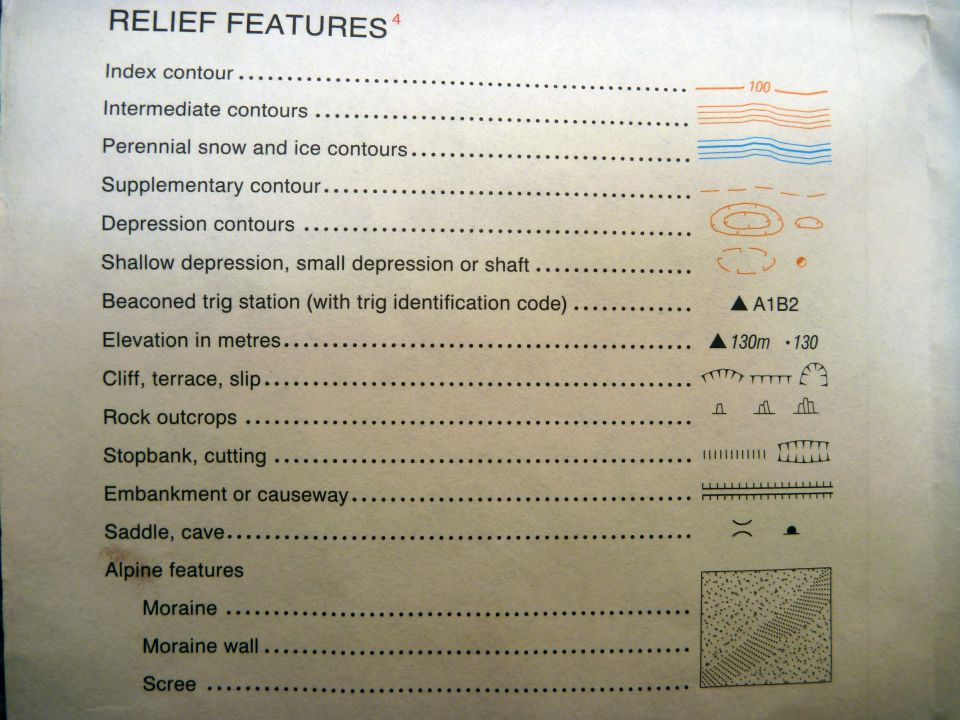
The legend on a map shows the symbols used to represent features on the ground. These features include roads, tracks, rivers, lakes, vegetation, fences, buildings, power lines etc. Given the size of the map it is not possible to show all features on the ground. Symbols are grouped in themes on the legend.
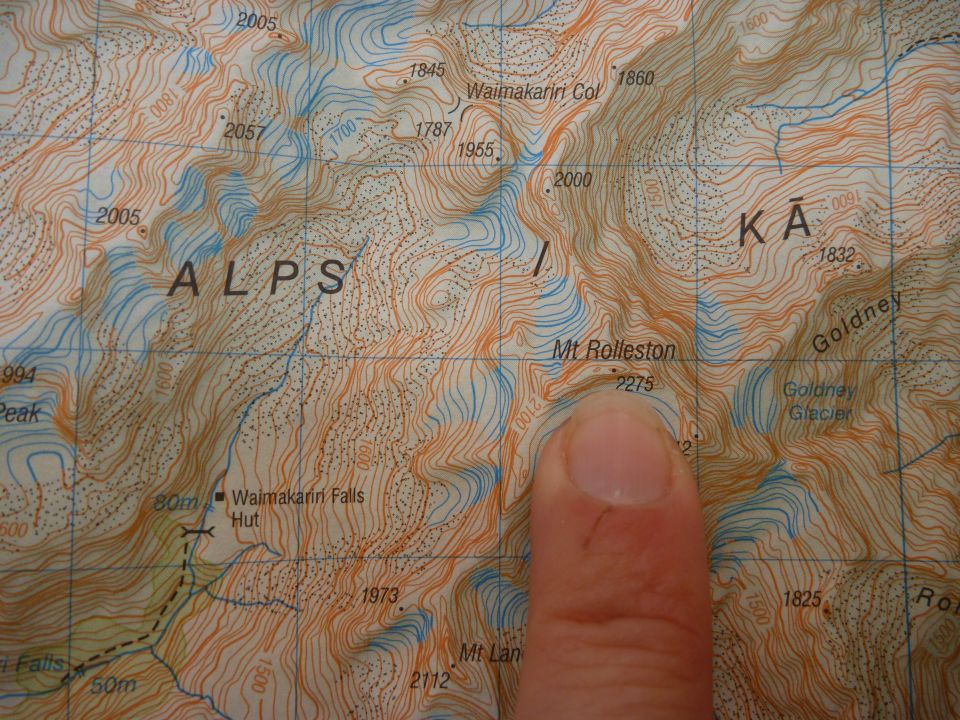
Topo50 maps show 20 metre contour lines. These lines join points of equal height and represent the relief or height of the land. Contour lines that are close together show steep land. Contour lines that are far apart show that the land has gentle slopes. Contour values read uphill. As you read the contour numbers, you will be looking uphill.
As well as contour lines, maps also show relief shading to help visualise the terrain. Hills and valleys are shaded as if the sun was shining from the north-west.
Map coordinates can be shown as:
To find out more about reading topographical maps go to the 36 page LINZ Topo50 Map guide (PDF 1.5Mb).
Visit the online topographic maps at http://www.topomap.co.nz/.
Access to digital map data that LINZ uses to make printed topographic maps is available through the online LINZ Data Service (LDS) as vector data suitable for use in a GIS. Georeferenced TIFF images of the topographic maps are also available through the LDS - the LINZ data service.

,This is a Topo50 map made by LINZ which shows features that appear on the Earth's surface in a certain area. Image: LEARNZ.

,All maps have a legend which shows the symbols for certain features that are shown on the map. Image: LEARNZ.

,Contour lines are shown at 20 metre intervals on Topo50 maps. Notice how the contour lines beneath the summit of Mount Rolleston are very close together indicating steep terrain. Image: LEARNZ.
Many different people rely on topographic maps. Anyone venturing into the outdoors needs to take a topographic map with them to ensure they know where they are and where they are going. Image: LEARNZ.
Take a look at a Topo50 map of your local area and locate where you live on the map.